 10 分钟上手 pandas
# 1. Pandas 基础操作(1)
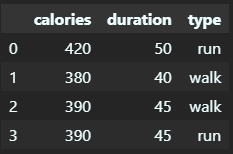
# 1.1 从 Python 字典生成 DataFrame 表格
import pandas as pd

# 创建表格
workout_dict = {
  "calories": [420, 380, 390, 390],
  "duration": [50, 40, 45, 45],
  "type": ['run', 'walk', 'walk', 'run']
}

workout = pd.DataFrame(workout_dict)
display(workout)
print(type(workout))
2
3
4
5
6
7
8
9
10
11
12
display函数是 Jupyter Notebook 中内置了的函数,用于打印展示一个 object。
# 1.2 colomn index 与 row index
>>> workout.columns  # 访问列索引
Index(['calories', 'duration', 'type'], dtype='object')

>>> workout.index	# 访问行索引
RangeIndex(start=0, stop=4, step=1)

>>> workout.columns.tolist()
['calories', 'duration', 'type']

>>> workout.index.tolist()
[0, 1, 2, 3]
2
3
4
5
6
7
8
9
10
11
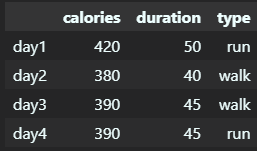
# 1.3 DataFrame 单独指定/改变索引
重建行/列索引:
# 直接重新赋值行索引
workout.index = ["day1", "day2", "day3", "day4"]
# 直接重新赋值列索引
workout.columns = ["calories", "duration", "type"]
display(workout)
2
3
4
5
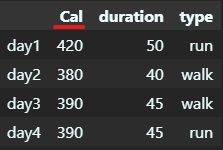
单独修改某一列的列名/索引
# 单独改变某一列列名/索引
workout = workout.rename(columns={'calories': 'Cal'})

display(workout)
2
3
4
从 DataFrame 转换回 dict 字典:
>>> from devtools import debug
>>> workout_dict = workout.to_dict()  # 转换回 dict 字典
>>> debug(workout_dict)

    workout_dict: {
        'Cal': {
            'day1': 420,
            'day2': 380,
            'day3': 390,
            'day4': 390,
        },
        'duration': {
            'day1': 50,
            'day2': 40,
            'day3': 45,
            'day4': 45,
        },
        'type': {
            'day1': 'run',
            'day2': 'walk',
            'day3': 'walk',
            'day4': 'run',
        },
    } (dict) len=3
2
3
4
5
6
7
8
9
10
11
12
13
14
15
16
17
18
19
20
21
22
23
24
# 1.4 访问表格中的列与行(使用 [ ] 访问)
选择一列:
# 选择一列
print(workout['calories'])
print('-' * 10)
print(type(workout['calories']))
2
3
4
输出:
day1    420
day2    380
day3    390
day4    390
Name: calories, dtype: int64
----------
<class 'pandas.core.series.Series'>
2
3
4
5
6
7
- 注意这里返回的是 Series 类型
选择一列(保留列表格式):
# 选择一列(保留列表格式)
print(workout[['calories']])
print('-' * 10)
print(type(workout[['calories']]))
2
3
4
输出:
      calories
day1       420
day2       380
day3       390
day4       390
----------
<class 'pandas.core.frame.DataFrame'>
2
3
4
5
6
7
- 注意这里返回的是 DataFrame 类型,也就是保留了列表的格式
- 这种选择方式可以同时选择多列
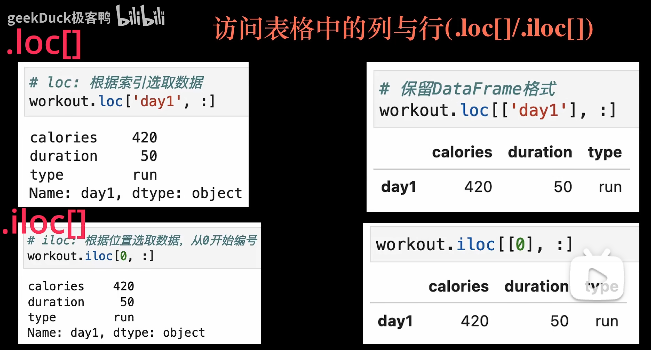
# 1.5 访问表格中的列与行(使用 .loc[] 或 .iloc[])
- loc:根据索引选取数据
- iloc:根据位置选取数据(记为:i 通常用来指代数字,所以 iloc 是用数字来访问)
# 1.6 访问多行多列
可以使用 loc 或 iloc 来访问多行多列:
workout.iloc[0:2, 0:2]
# workout.iloc[[0, 1], [0, 1]]
2
输出:
      calories  duration
day1       420        50
day2       380        40
2
3
# 1.7 访问表格中的某一格(使用 .at[])
>>> workout.at['day1', 'calories']
420

# 改变数据
>>> workout.at['day1', 'calories'] = 800
2
3
4
5
# 2. Pandas 基本操作(2)
这里使用 titanic.csv 作为示例演示。
# 2.1 read_csv:导入 csv 表格数据
# 常用参数:index_col: 索引行;sep:分隔符;header;
>>> titanic = pd.read_cvs("./titanic.csv")

>>> print(len(titanic))
891

>>> print(titanic.shape)
(891, 12)
2
3
4
5
6
7
8
更多输出/输入格式(pickle/csv/excel/html/xml/json/latex/HDFS…)参考:
# 2.2 打印表格的部分行
- titanic.head():返回数据前 5 行
- titanic.tail(10):返回数据最后 10 行
- titanic.sample(10):任意返回 10 行数据
# 2.3 describe()
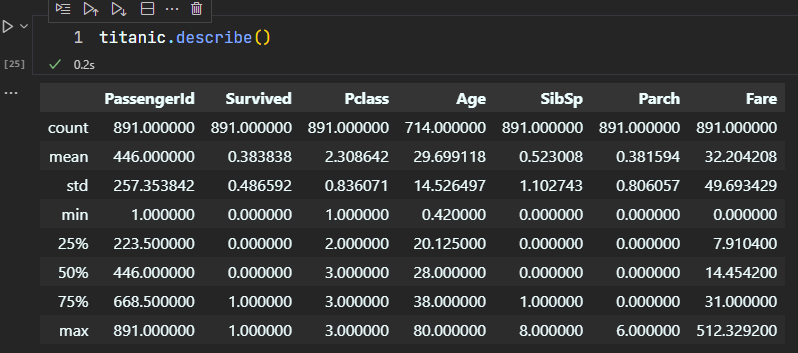
.describe():描述数据类型的列
>>> titanic.describe()
# 2.4 info()
.info():显示表格索引/列的类型/占据内存等信息

# 2.5 dtypes
.dtypes:每一列的类型
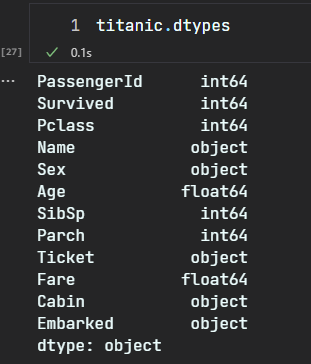
注意 pandas 类型与 py/numpy 的数据类型的对应关系:
| pandas 类型 | 含义 | 对应 py/numpy 数据类型 |
|---|---|---|
| object | 字符串 | str |
| int64 | 整数型 | np.int64 |
| float64 | 小数型 | np.float64 |
| bool | 布尔型 | np.bool_ |
| datetime64 | 时间型 | np.datetime64 |
| timedelta[ns] | 时间差型 | np.datedelta |
| category | 种类类型 | 不存在 |
# 2.6 unique()
.unique():得到 pandas Series 序列中所有出现过的值。可以用来查看 DataFrame 的一列所有出现过的值,这样可以对数据的列的定义有更好的了解。
>>> titanic['Sex'].unique()  # 性别属性
array(['male', 'female'], dtype=object)

>>> titanic['Pclass'].unique()  # 打印所有的船舱等级
array([3, 1, 2])
2
3
4
5
# 2.7 groupby()
DF.groupby():根据列的值分类,对每个类型统计信息
>>> titanic[['Sex', 'PassengerId']].groupby(['Sex']).count()
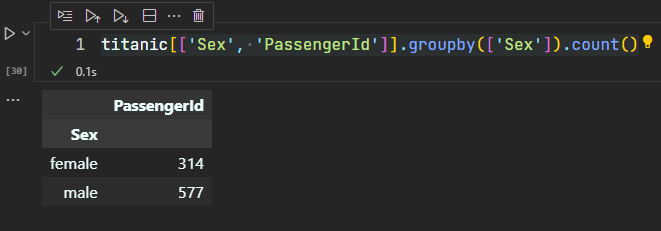
- 由此看到,女性有 314 人,男性有 577 人
groupby 该可以根据多列的值分类
survive_by_class = titanic[['Pclass', 'Survived', 'PassengerId']].groupby(
    ['Pclass', 'Survived']).count()
display(survive_by_class)
2
3
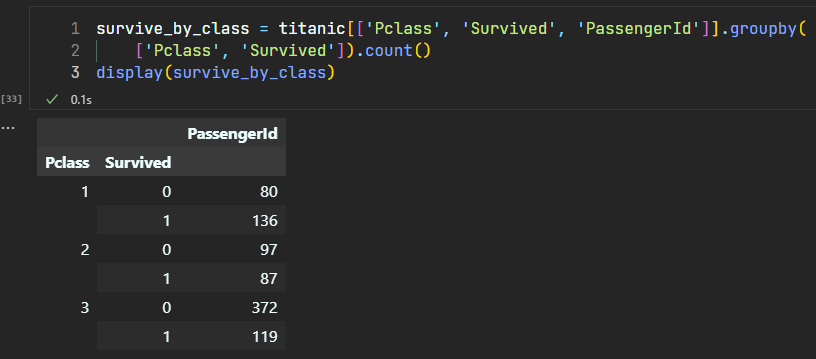
- 注意,我们 groupby 的变成了行的索引,而且这是个多级索引
# 2.8 reset_index()
reset_index 可以将那些成为行索引的列重新归还为普通的一个列。
survive_by_class = survive_by_class.reset_index()
survive_by_class = survive_by_class.rename(
    columns={'PassengerId': 'count'}
)
print(survive_by_class)
2
3
4
5
输出:
   index  Pclass  Survived  count
0      0       1         0     80
1      1       1         1    136
2      2       2         0     97
3      3       2         1     87
4      4       3         0    372
5      5       3         1    119
2
3
4
5
6
7
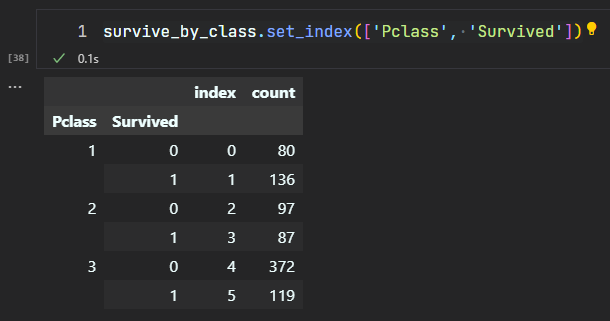
# 2.9 set_index()
set_index 与 reset_index 互为逆运算:
survive_by_class.set_index(['Pclass', 'Survived'])
# 2.10 根据列的值动态选择行(filtering)
首先写出筛选条件:
>>> filt = (~titanic['Age'].isnull())
>>> print(filt)
0       True
1       True
2       True
3       True
4       True
       ...
886     True
887     True
888    False
889     True
890     True
Name: Age, Length: 891, dtype: bool
2
3
4
5
6
7
8
9
10
11
12
13
14
- 在为了得到 filt 时,还可以使用的符号有:
& | ~
动态选择行:
titanic = titanic.loc[filt, :]
titanic.head()
2

逻辑符号如下:
| 符号 | 含义 | 运算规则 |
|---|---|---|
| ~ | 按照位置取反(not) | (T, F) -> (F, T) |
| & | 按照位置取和(and) | (T, T, F) & (T, F, T) -> (T, F, F) |
| | | 按照位置取或(or) | (T, T, F) | (T, F, T) -> (T, T, T) |
# 2.11 agg()
.agg():一次性得到多种统计信息
# 使用agg完成很多统计量的计算
def percentile_25(x):
    return x.quantile(0.25)

def percentile_75(x):
    return x.quantile(0.75)

age_agg = titanic[['Pclass', 'Survived', 'Age']].groupby(['Pclass', 'Survived']).agg(
    ['min', 'max', 'median', 'mean', len, np.std, percentile_25, percentile_75])

display(age_agg)
2
3
4
5
6
7
8
9
10
11
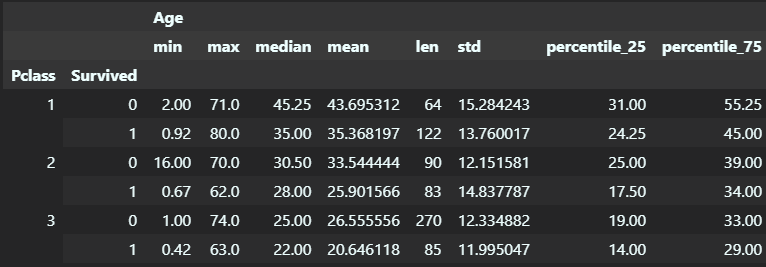
注意它的行/列都是多级索引:
>>> print(age_agg.columns)
MultiIndex([('Age',           'min'),
            ('Age',           'max'),
            ('Age',        'median'),
            ('Age',          'mean'),
            ('Age',           'len'),
            ('Age',           'std'),
            ('Age', 'percentile_25'),
            ('Age', 'percentile_75')],
           )
2
3
4
5
6
7
8
9
10
多级索引的访问方式:
# 方法1: 分级访问
age_med = age_agg.loc[:, 'Age']['median']
# 方法2: 一次性访问
# age_med = age_agg.loc[:, ('Age', 'median')]
age_med
2
3
4
5
Pclass  Survived
1       0           45.25
        1           35.00
2       0           30.50
        1           28.00
3       0           25.00
        1           22.00
Name: median, dtype: float64
2
3
4
5
6
7
8
# 2.12 Series
Series 序列的三大属性:name, values, index
print(age_med.name)
print('-' * 10)
print(age_med.values)
print('-' * 10)
print(age_med.index)
2
3
4
5
输出:
median
----------
[45.25 35.   30.5  28.   25.   22.  ]
----------
MultiIndex([(1, 0),
            (1, 1),
            (2, 0),
            (2, 1),
            (3, 0),
            (3, 1)],
           names=['Pclass', 'Survived'])
2
3
4
5
6
7
8
9
10
11
DataFrame 的一行或一列都可以表示为单独的一个 Series。
# 3. 常见工作流程
# 3.1 字符串的处理
- 使用 str 预定义的函数
- 直接拼接
- 使用 apply 函数
- 更多信息:https://pandas.pydata.org/docs/user_guide/text.html
# 3.1.1 字符串处理 —— 使用 str 预定义的函数
在选中一个 Series 后,可以调用 .str 后再调用相关字符串函数来处理这一 Series 的字符串:
>>> titanic['Name'].str.upper()
0                                BRAUND, MR. OWEN HARRIS
1      CUMINGS, MRS. JOHN BRADLEY (FLORENCE BRIGGS TH...
2                                 HEIKKINEN, MISS. LAINA
3           FUTRELLE, MRS. JACQUES HEATH (LILY MAY PEEL)
4                               ALLEN, MR. WILLIAM HENRY
                             ...
885                 RICE, MRS. WILLIAM (MARGARET NORTON)
886                                MONTVILA, REV. JUOZAS
887                         GRAHAM, MISS. MARGARET EDITH
889                                BEHR, MR. KARL HOWELL
890                                  DOOLEY, MR. PATRICK
Name: Name, Length: 714, dtype: object
2
3
4
5
6
7
8
9
10
11
12
13
这个 .str 甚至可以连环使用:
>>> titanic['Name'].str.upper().str.replace(" ", "_")
0                                BRAUND,_MR._OWEN_HARRIS
1      CUMINGS,_MRS._JOHN_BRADLEY_(FLORENCE_BRIGGS_TH...
2                                 HEIKKINEN,_MISS._LAINA
3           FUTRELLE,_MRS._JACQUES_HEATH_(LILY_MAY_PEEL)
4                               ALLEN,_MR._WILLIAM_HENRY
                             ...
885                 RICE,_MRS._WILLIAM_(MARGARET_NORTON)
886                                MONTVILA,_REV._JUOZAS
887                         GRAHAM,_MISS._MARGARET_EDITH
889                                BEHR,_MR._KARL_HOWELL
890                                  DOOLEY,_MR._PATRICK
Name: Name, Length: 714, dtype: object
2
3
4
5
6
7
8
9
10
11
12
13
具体在 .str 后面可以接的函数与 Python 原生的 str 很像。
可以使用 split 来分割字符串:
>>> titanic['Name'].str.split(',')
0                             [Braund,  Mr. Owen Harris]
1      [Cumings,  Mrs. John Bradley (Florence Briggs ...
2                              [Heikkinen,  Miss. Laina]
3        [Futrelle,  Mrs. Jacques Heath (Lily May Peel)]
4                            [Allen,  Mr. William Henry]
                             ...
885              [Rice,  Mrs. William (Margaret Norton)]
886                             [Montvila,  Rev. Juozas]
887                      [Graham,  Miss. Margaret Edith]
889                             [Behr,  Mr. Karl Howell]
890                               [Dooley,  Mr. Patrick]
Name: Name, Length: 714, dtype: object
2
3
4
5
6
7
8
9
10
11
12
13
通过这种 .str 后再调用函数的方式得到的 Series 可以直接再赋值给 DF 的新列:
>>> titanic['lastName'] = titanic['Name'].str.split(',').str[0]
- 现在,titanic 这个 DF 又多出了一个 ‘lastName’ 的列。
# 3.1.2 字符串处理 —— 字符串直接拼接
titanic['nameSex'] = titanic['lastName'] + '_' + titanic['Sex']
print(titanic['nameSex'])
2
输出:
0           Braund_male
1        Cumings_female
2      Heikkinen_female
3       Futrelle_female
4            Allen_male
             ...
885         Rice_female
886       Montvila_male
887       Graham_female
889           Behr_male
890         Dooley_male
Name: nameSex, Length: 714, dtype: object
2
3
4
5
6
7
8
9
10
11
12
# 3.1.3 字符串处理 —— apply 函数
apply()方法主要用于数据清理,它侧重于对 pandas Series 中的每一个元素或 pandas DataFrame 中的每一行/一列应用该方法。
apply(func, axis=0, raw=False, result_type=None, agrs=(), **kwargs):
- func:函数,要应用于每一列或每一行的函数。
- axis:默认为0,0对应行索引,将func函数应用于每一列;1对应列,将函数应用于每一行。
- raw:布尔值,默认为 False,确定行或列是否作为 Series 或 ndarray 对象传递。
- False:将每一行或每一列作为一个 Series 对象传递给函数;
- True:函数将接收 ndarray 对象。
- 默认情况下,result_type=None,最终返回的类型是从 func 函数的返回推断出来的,否则它就取决于 result_type 参数。
- args:元组,除了数组和 Series 之外,要传递给 func 的位置参数。
**kwargs:传递给 func 的附加关键字参数。
返回:
- func 函数沿 Dataframe 的给定轴应用的结果。
>>> df = pd.DataFrame([[4, 9]]*3,  columns=['A', 'B'])
>>> print(df)
   A  B
0  4  9
1  4  9
2  4  9

>>> df.apply(np.sqrt)
     A    B
0  2.0  3.0
1  2.0  3.0
2  2.0  3.0

>>> df.apply(np.sum, axis=0)
A    12
B    27
dtype: int64

>>> df.apply(np.sum, axis=1)
0    13
1    13
2    13
dtype: int64
2
3
4
5
6
7
8
9
10
11
12
13
14
15
16
17
18
19
20
21
22
23
所以对于复杂的字符串处理,我们也可以写自定义一个函数,然后交给 apply。
